Posts
Benefits of Data Visualization
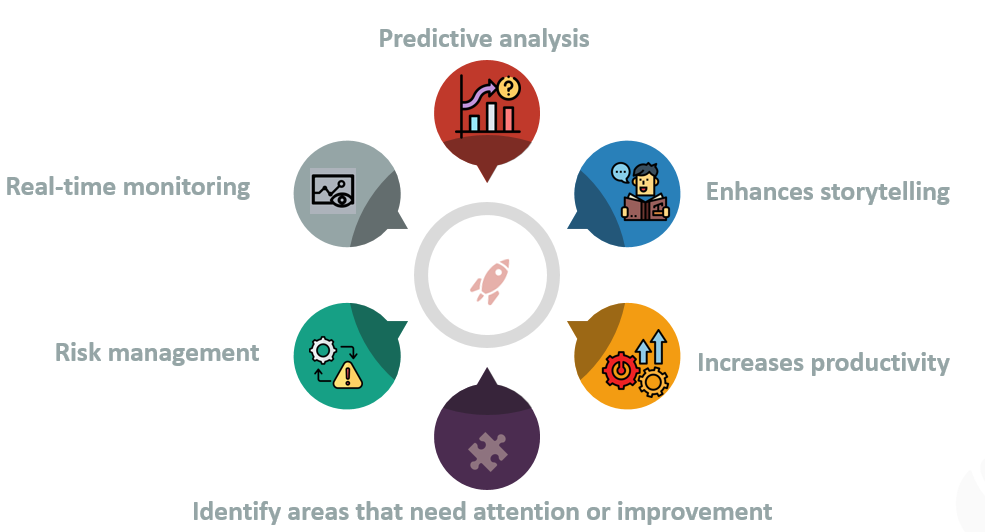
Data Viz over Traditional Methods Simplifies complex data Data visualization transforms large and complicated datasets into a visual format, making the data easier to understand and interpret. It allows people to view data in a more digestible and accessible way. Reveals patterns and trends Graphs, charts, and other visual formats help reveal patterns, correlations, and trends in the data that might not be as noticeable in raw, numerical form. This ability to quickly recognize and understand these patterns can lead to faster decision-making, saving time and resources. Aids in decision making By helping to highlight key insights, data visualization aids in faster and more effective decision-making. Businesses can quickly assess their performance, competitive landscape, customer behavior, and market trends, allowing them to make informed strategic decisions. Improves retention and engagement Visual data is more engaging and easier to remember than raw data. A well-designed vi...