Benefits of Data Visualization
Data Viz over Traditional Methods
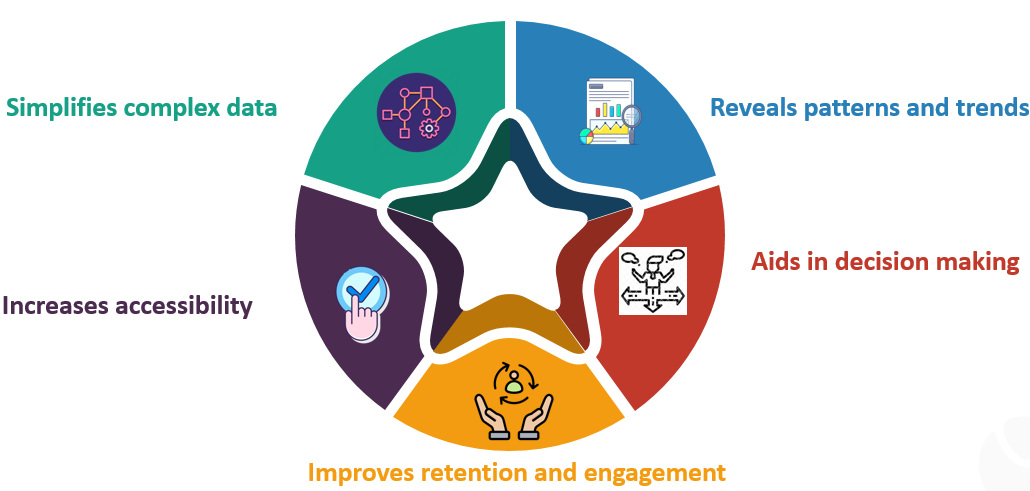
Simplifies complex data
Data visualization transforms large and complicated datasets into a visual format, making the data easier to understand and interpret. It allows people to view data in a more digestible and accessible way.
Reveals patterns and trends
Graphs, charts, and other visual formats help reveal patterns, correlations, and trends in the data that might not be as noticeable in raw, numerical form. This ability to quickly recognize and understand these patterns can lead to faster decision-making, saving time and resources.
Aids in decision making
By helping to highlight key insights, data visualization aids in faster and more effective decision-making. Businesses can quickly assess their performance, competitive landscape, customer behavior, and market trends, allowing them to make informed strategic decisions.
Improves retention and engagement
Visual data is more engaging and easier to remember than raw data. A well-designed visualization can tell a compelling story about what the data means, making it an excellent tool for presentations, reports, and stakeholder communications.
Increases accessibility
Not everyone is a data expert. Data visualization makes data more accessible to a wider audience, from executives to operational teams, enhancing overall data literacy within the organization.
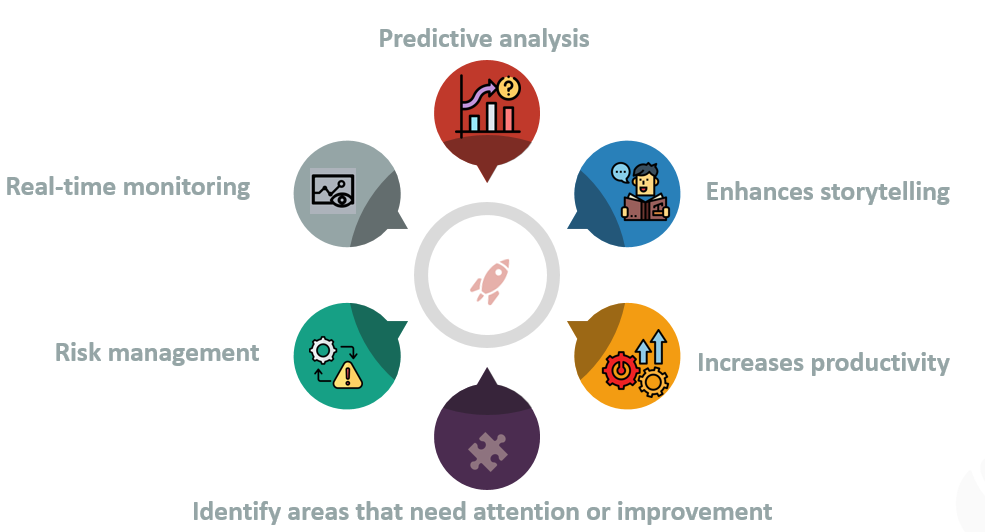
Real-time monitoring
With the rise of interactive dashboards, businesses can monitor their operations in real-time. This can help with tasks like tracking sales performance, monitoring supply chains, and managing operational efficiency.
Identify areas that need attention or improvement
Visualization of data can highlight areas where a business can improve. This could be a department not reaching targets, a product not performing well, or a process that needs streamlining.
Predictive analysis
Advanced visualization tools enable businesses to predict future trends based on historical data. This can be useful for forecasting sales, demand, and other important business metrics.
Enhances storytelling
With data visualization, businesses can tell better stories. This is particularly useful when it comes to convincing stakeholders, training teams, or attracting customers. Visual data stories are compelling, engaging, and easily comprehensible.
Increases productivity
With immediate insights from visualized data, teams can act promptly, avoiding the delays that come with data confusion or misinterpretation. This can greatly enhance productivity within a business.
Risk management
Data visualization can help organizations understand complex scenarios that involve risks and uncertainties in a better way. The visual simplification of data can assist in identifying the potential areas of risk.
It enables organizations to navigate the complex data landscapes they operate within, ensuring they can make the most of the information they generate and collect. From enhancing decision-making to improving communication, the benefits of data visualization are vast and significant.


Comments
Post a Comment